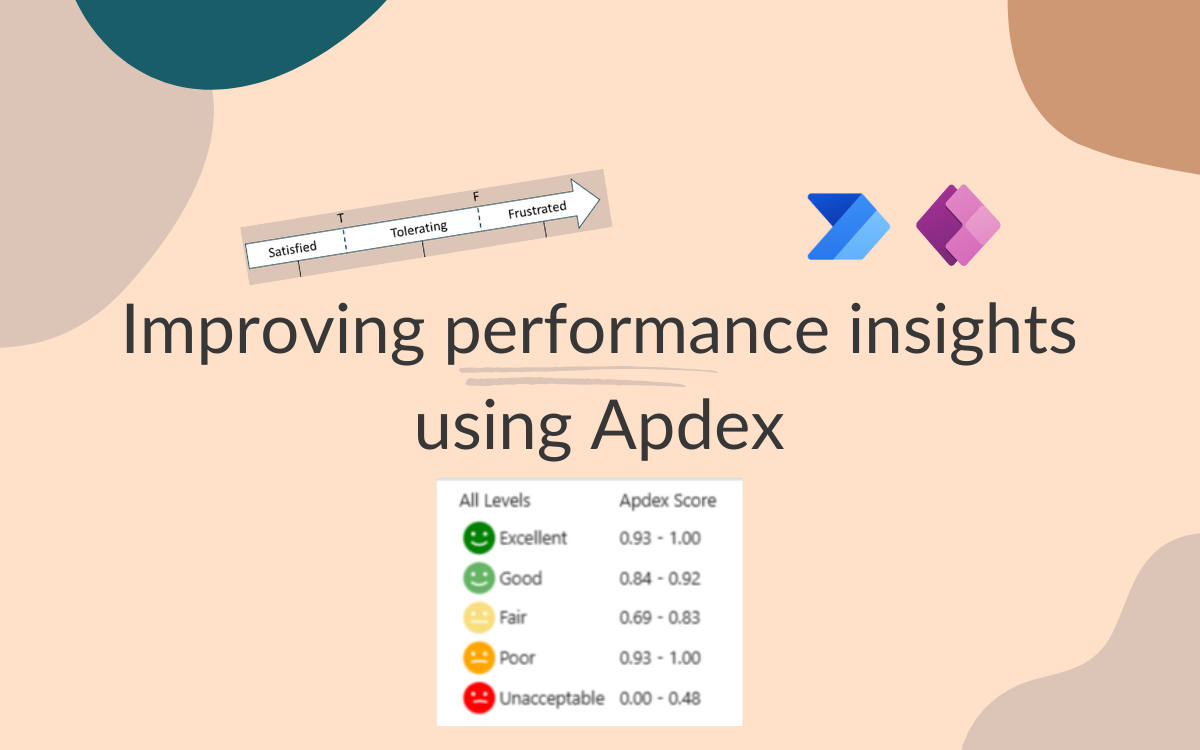
Improving performance insights using Apdex
Feb 11, 2025 • 9 • 1846
Table of contents
Scenario
Ever heard users complain about the sluggishness of your Power Automate flow? But how do we know if that complaint is based on actual performance or just a feeling?
In this blog, we’ll explore how to move from subjective complaints to objective insights by using Apdex scores to evaluate Power Automate flow performance.
What is Apdex and how does it help in measuring flow performance?
Apdex Overview
Apdex (Application Performance Index) is a standardized way of measuring user satisfaction with application performance. It uses a scoring system that tracks how long it takes for a flow to respond, translating that into a more user-experience-oriented metric.
How Apdex improves subjectivity
Apdex scores take the guesswork out of performance monitoring. Instead of relying on vague complaints like “the flow is slow,” Apdex translates user experience into a clear, numerical score. This way, developers and users alike can objectively see how the flow is performing in real time.
The way the score is calculate is explained in the image below:
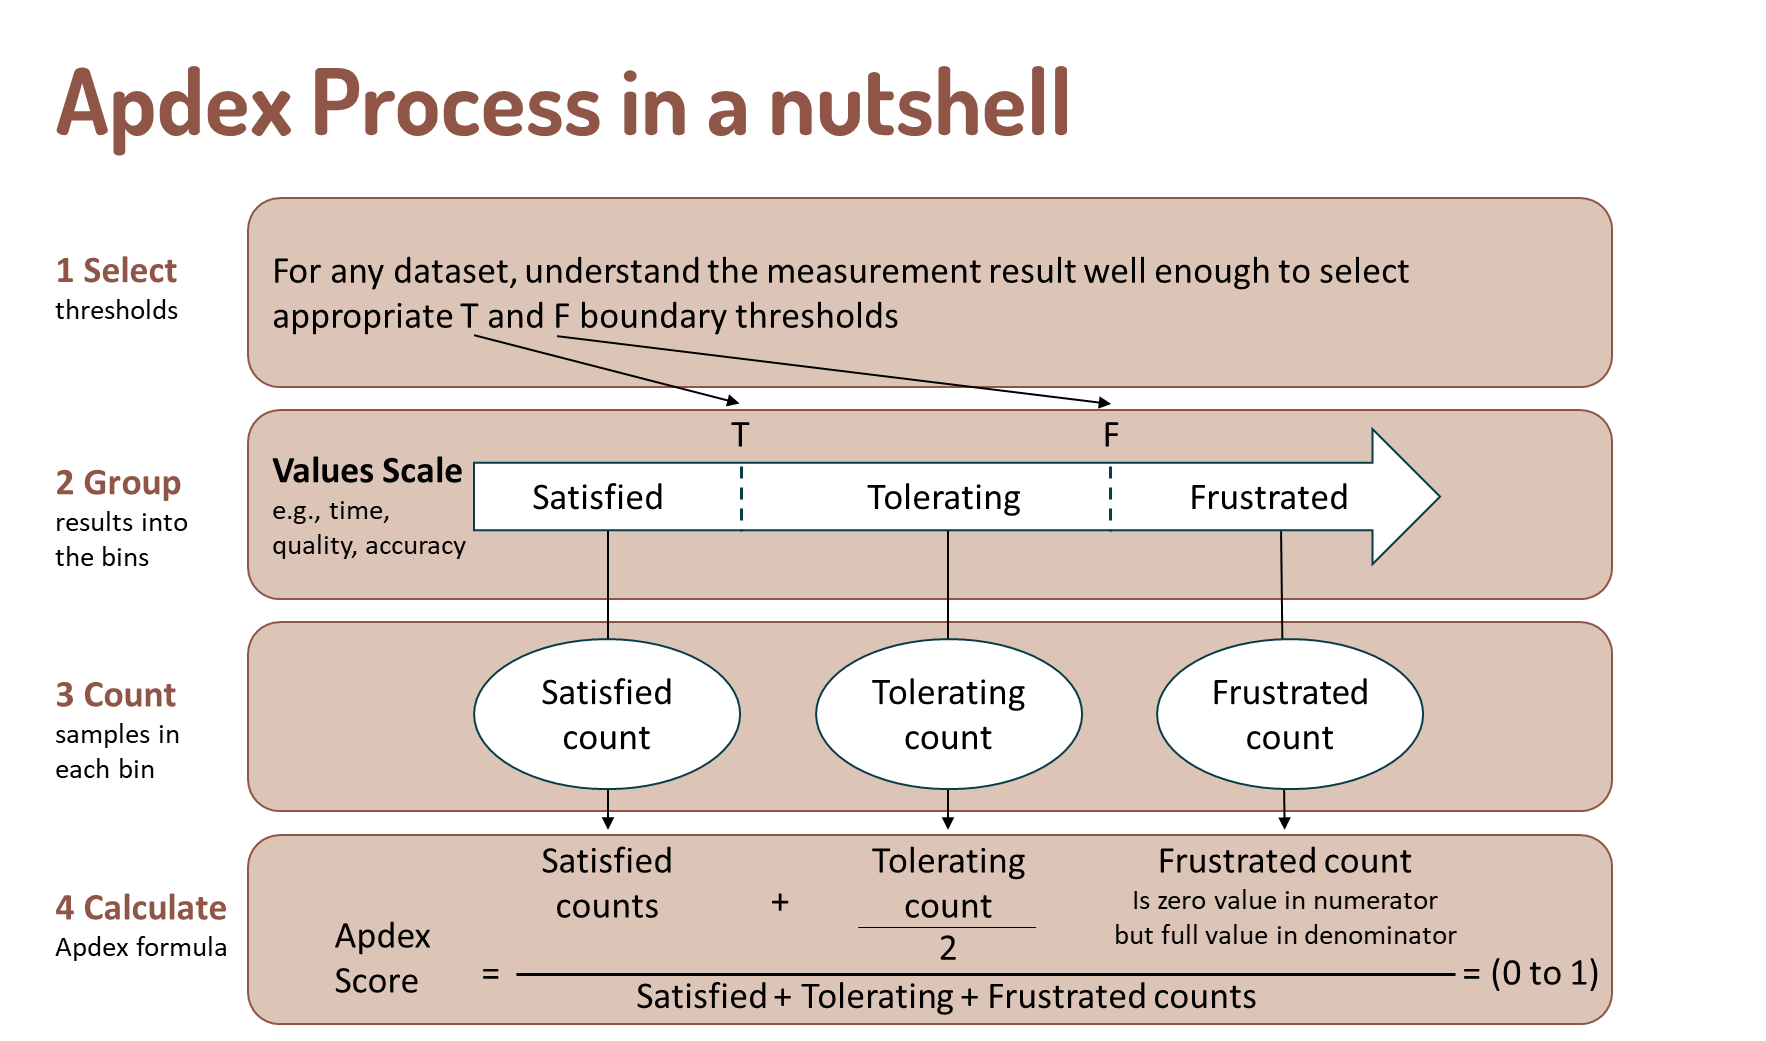
Apdex Scoring Breakdown
- Satisfied: Fast response time, users are happy.
- Tolerating: Average response time, users are somewhat satisfied but could be better.
- Frustrated: Slow response time, users are unhappy and likely to abandon the process.
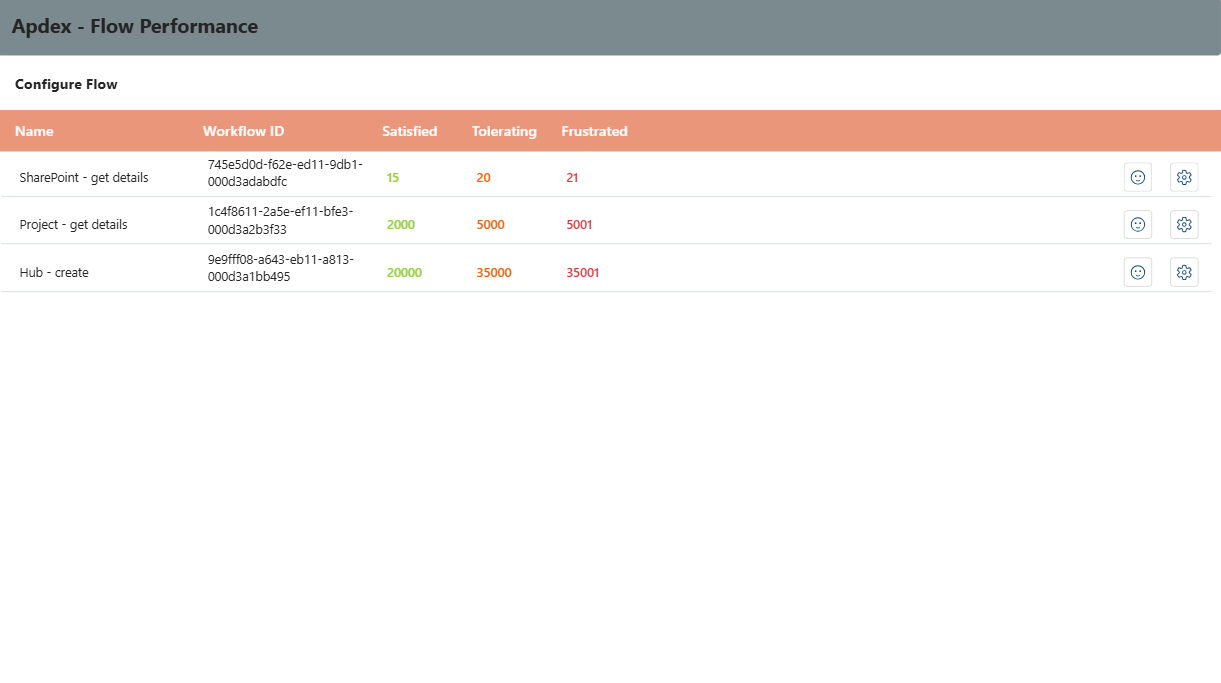
Visualizing performance with Apdex scores
By default there is a Flow Run table in Dataverse available in which the runs of a flow are stored including their duration. Next to that the values for satisfied, tolerating and frustrated needs to be determined. This data is stored in another table in Dataverse as well.
Some calculation needs to be done and than it is possible to display the values in a user-friendly way in a Power App.
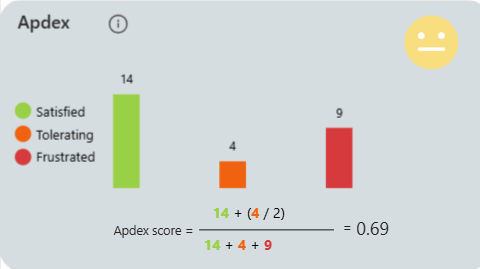
The end result look like this:
Details for the user to see the explanation of the scores and how the score is calculated.
Apdex Score Component
The Apdex Score values are shown using a component. The YAML for the Apdex component:
- cmpApdex:
Control: Component
Properties:
ApdexScore: |+
=Table(
{Satisfied: Self.SatisfiedCount},
{Tolerating: Self.ToleratingCount},
{Frustrated: Self.FrustratedCount}
)
FrustratedCount: =100
SatisfiedCount: =600
ToleratingCount: =100
Height: =300
Children:
- conApdexDetails:
Control: GroupContainer
Variant: manualLayoutContainer
Properties:
Fill: =RGBA(214, 221, 224, 1)
Height: =Parent.Height
RadiusBottomLeft: =24
RadiusBottomRight: =24
RadiusTopLeft: =24
RadiusTopRight: =24
Width: =Parent.Width
Children:
- conFormulaCalculation:
Control: GroupContainer
Variant: manualLayoutContainer
Properties:
DropShadow: =DropShadow.None
Height: =90
Width: =372
X: =(Parent.Width - Self.Width)/2
Y: =Parent.Height - Self.Height
Children:
- txtApdexisValue:
Control: Text
Properties:
Size: =20
Text: =Round((cmpApdex.SatisfiedCount + (cmpApdex.FrustratedCount / 2)) / (cmpApdex.SatisfiedCount + cmpApdex.ToleratingCount + cmpApdex.FrustratedCount),2)
VerticalAlign: =VerticalAlign.Middle
Width: =71
X: =txtApdexis_2.X + txtApdexis_2.Width
Y: =txtApdexis_2.Y
- txtApdexis_2:
Control: Text
Properties:
Text: ="= "
VerticalAlign: =VerticalAlign.Middle
Width: =15
X: =Rectangle2_1.X + Rectangle2_1.Width + 10
Y: '=Rectangle2_1.Y - 18 '
- HtmlFormulaTotalValue:
Control: HtmlViewer
Properties:
HtmlText: ="<b><font color=#98D046>"& cmpApdex.SatisfiedCount & "</font></b> + <b><font color=#f0620f>"& cmpApdex.ToleratingCount & "</font></b> + <b><font color=#d73a3c>"& cmpApdex.FrustratedCount & "</font></b>"
Height: =43
Size: =12
Width: =150
X: =136
Y: =Rectangle2_1.Y + Rectangle2_1.Height
- Rectangle2_1:
Control: Rectangle
Properties:
Fill: =Color.Black
Height: =1
Width: =HtmlFormulaTotalValue.Width
X: =HtmlFormulaTotalValue.X
Y: =45
- HtmlFormulaValue:
Control: HtmlViewer
Properties:
HtmlText: ="<b><font color=#98D046>"& cmpApdex.SatisfiedCount & "</font></b> + (<b><font color=#f0620f>"& cmpApdex.ToleratingCount & "</font></b> / 2)"
Height: =35
Size: =12
Width: =130
X: =Rectangle2_1.X + (Rectangle2_1.Width - Self.Width) /2
Y: =Rectangle2_1.Y - Self.Height
- txtApdexis_1:
Control: Text
Properties:
Text: ="Apdex score = "
VerticalAlign: =VerticalAlign.Middle
X: =40
Y: =30
- txtTitleApdex:
Control: Text
Properties:
Size: =20
Text: ="Apdex"
Weight: ='TextCanvas.Weight'.Semibold
X: =20
Y: =10
- infoApdex:
Control: InfoButton
Properties:
OnSelect: =Set(varShowFormula, !varShowFormula)
AccessibleLabel: ="info"
Content: ="Application Performance Index"
X: =txtTitleApdex.Width + txtTitleApdex.X
Y: =txtTitleApdex.Y
- CompositeColumnChart1:
Control: Group
Children:
- Legend1:
Control: Legend
Properties:
Items: =ColumnChart1.SeriesLabels
Height: =89
ItemColorSet: =ColumnChart1.ItemColorSet
Width: =114
X: =10
Y: =109
- ColumnChart1:
Control: BarChart
Properties:
AccessibleLabel: ="chart"
Items: =cmpApdex.ApdexScore
DisplayMode: =DisplayMode.View
Font: =uiFont.Primary
GridStyle: =GridStyle.None
Height: =153
ItemColorSet: =[RGBA(152, 208, 70, 1),RGBA(240, 98, 15, 1), RGBA(215, 58, 60, 1)]
NumberOfSeries: =3
SeriesAxisMin: =0
Width: =328
X: =71
XLabelAngle: =0
Y: =57
YLabelAngle: =20
- Title1:
Control: Label
Properties:
Text: ="Chart Title"
Align: =Align.Center
Height: =12
Visible: =false
Width: =409
X: =35
Y: =158
- imgSmile:
Control: Image
Properties:
OnSelect: =Set(varShowLegend, !varShowLegend)
AccessibleLabel: ="Smile"
Image: "=If((Value(txtApdexisValue.Text) >= 0.93 And Value(txtApdexisValue.Text) <= 1), \r\n\r\n\"data:image/svg+xml;utf8, \"&EncodeUrl(\"\r\n<svg xmlns='http://www.w3.org/2000/svg' viewBox='0 0 100 100' width='100' height='100'>\r\n \r\n <circle cx='50' cy='50' r='40' fill='green' />\r\n \r\n <circle cx='35' cy='40' r='5' fill='white' />\r\n <circle cx='65' cy='40' r='5' fill='white' />\r\n \r\n <path d='M 30 60 Q 50 75, 70 60' stroke='white' stroke-width='5' fill='transparent' />\r\n</svg>\r\n\"),\r\n\r\n(Value(txtApdexisValue.Text) >= 0.84 And Value(txtApdexisValue.Text) <= 0.92), \r\n\"data:image/svg+xml;utf8, \"&EncodeUrl(\"\r\n<svg xmlns='http://www.w3.org/2000/svg' viewBox='0 0 100 100' width='100' height='100'>\r\n \r\n <circle cx='50' cy='50' r='40' fill='#66b366' />\r\n \r\n <circle cx='35' cy='40' r='5' fill='white' />\r\n <circle cx='65' cy='40' r='5' fill='white' />\r\n \r\n <path d='M 30 60 Q 50 75, 70 60' stroke='white' stroke-width='5' fill='transparent' />\r\n</svg>\r\n\"),\r\n\r\n(Value(txtApdexisValue.Text) >= 0.69 And Value(txtApdexisValue.Text) <= 0.83), \r\n\"data:image/svg+xml;utf8, \"&EncodeUrl(\"\r\n<svg xmlns='http://www.w3.org/2000/svg' viewBox='0 0 100 100' width='100' height='100'>\r\n \r\n <circle cx='50' cy='50' r='40' fill='#f8de7e' />\r\n \r\n <!-- Eyes -->\r\n <circle cx='35' cy='40' r='5' fill='white' />\r\n <circle cx='65' cy='40' r='5' fill='white' />\r\n \r\n <!-- Straight Mouth -->\r\n <path d='M 30 60 H 70' stroke='white' stroke-width='5' fill='transparent' />\r\n</svg>\r\n\r\n\r\n\"),\r\n\r\n(Value(txtApdexisValue.Text) >= 0.49 And Value(txtApdexisValue.Text) <= 0.68), \r\n\"data:image/svg+xml;utf8, \"&EncodeUrl(\"\r\n<svg xmlns='http://www.w3.org/2000/svg' viewBox='0 0 100 100' width='100' height='100'>\r\n <!-- Circle (Face) with orange color -->\r\n <circle cx='50' cy='50' r='40' fill='orange' />\r\n \r\n <!-- Eyes -->\r\n <circle cx='35' cy='40' r='5' fill='white' />\r\n <circle cx='65' cy='40' r='5' fill='white' />\r\n \r\n <!-- Sad Mouth -->\r\n <path d='M 30 60 Q 50 55, 70 60' stroke='white' stroke-width='5' fill='transparent' />\r\n</svg>\r\n\r\n\r\n\"),\r\n\r\n(Value(txtApdexisValue.Text) >= 0.00 And Value(txtApdexisValue.Text) <= 0.48), \r\n\"data:image/svg+xml;utf8, \"&EncodeUrl(\"\r\n<svg xmlns='http://www.w3.org/2000/svg' viewBox='0 0 100 100' width='100' height='100'>\r\n <!-- Circle (Face) with red color -->\r\n <circle cx='50' cy='50' r='40' fill='red' />\r\n \r\n <!-- Eyes -->\r\n <circle cx='35' cy='40' r='5' fill='white' />\r\n <circle cx='65' cy='40' r='5' fill='white' />\r\n \r\n <!-- Sad Mouth (More pronounced) -->\r\n <path d='M 35 60 Q 50 55, 70 60' stroke='white' stroke-width='5' fill='transparent' />\r\n</svg>\r\n\r\n\r\n\r\n\r\n\")\r\n\r\n)"
Height: =75
TabIndex: =0
Width: =75
X: =444
Y: =9
- conSmileExplanation:
Control: GroupContainer
Variant: manualLayoutContainer
Properties:
Fill: =RGBA(255, 255, 255, 1)
Visible: =varShowLegend
Width: =250
X: =Parent.Width - imgSmile.X + imgSmile.Width
Y: =40
Children:
- txtUnacceptableScore:
Control: Text
Properties:
Font: =uiFont.Primary
Text: ="0.00 - 0.48"
VerticalAlign: =VerticalAlign.Middle
X: =txtSmileExcellent.X + txtSmileExcellent.Width
Y: =imgSmileUnacceptable.Y
- txtSmileUnacceptable:
Control: Text
Properties:
Font: =uiFont.Primary
Text: ="Unacceptable"
VerticalAlign: =VerticalAlign.Middle
X: =imgSmileUnacceptable.X + imgSmileUnacceptable.Width
Y: =imgSmileUnacceptable.Y
- imgSmileUnacceptable:
Control: Image
Properties:
Image: "=\"data:image/svg+xml;utf8, \"&EncodeUrl(\"\r\n<svg xmlns='http://www.w3.org/2000/svg' viewBox='0 0 100 100' width='100' height='100'>\r\n <!-- Circle (Face) with red color -->\r\n <circle cx='50' cy='50' r='40' fill='red' />\r\n \r\n <!-- Eyes -->\r\n <circle cx='35' cy='40' r='5' fill='white' />\r\n <circle cx='65' cy='40' r='5' fill='white' />\r\n \r\n <!-- Sad Mouth (More pronounced) -->\r\n <path d='M 35 60 Q 50 55, 70 60' stroke='white' stroke-width='5' fill='transparent' />\r\n</svg>\r\n\r\n\")"
Height: =32
Width: =32
X: =imgSmileExcellent.X
Y: =imgSmilePoor.Y + imgSmilePoor.Height
- txtPoorScore:
Control: Text
Properties:
Font: =uiFont.Primary
Text: ="0.93 - 1.00"
VerticalAlign: =VerticalAlign.Middle
X: =txtSmileExcellent.X + txtSmileExcellent.Width
Y: =imgSmilePoor.Y
- txtSmilePoor:
Control: Text
Properties:
Font: =uiFont.Primary
Text: ="Poor"
VerticalAlign: =VerticalAlign.Middle
X: =imgSmilePoor.X + imgSmilePoor.Width
Y: =imgSmilePoor.Y
- imgSmilePoor:
Control: Image
Properties:
Image: "=\r\n\"data:image/svg+xml;utf8, \"&EncodeUrl(\"\r\n<svg xmlns='http://www.w3.org/2000/svg' viewBox='0 0 100 100' width='100' height='100'>\r\n <!-- Circle (Face) with orange color -->\r\n <circle cx='50' cy='50' r='40' fill='orange' />\r\n \r\n <!-- Eyes -->\r\n <circle cx='35' cy='40' r='5' fill='white' />\r\n <circle cx='65' cy='40' r='5' fill='white' />\r\n \r\n <!-- Sad Mouth -->\r\n <path d='M 30 60 Q 50 55, 70 60' stroke='white' stroke-width='5' fill='transparent' />\r\n</svg>\r\n\r\n\r\n\")"
Height: =32
Width: =32
X: =imgSmileExcellent.X
Y: =imgSmileFair.Y + imgSmileFair.Height
- txtFairScore:
Control: Text
Properties:
Font: =uiFont.Primary
Text: ="0.69 - 0.83"
VerticalAlign: =VerticalAlign.Middle
X: =txtSmileExcellent.X + txtSmileExcellent.Width
Y: =imgSmileFair.Y
- txtSmileFair:
Control: Text
Properties:
Font: =uiFont.Primary
Text: ="Fair"
VerticalAlign: =VerticalAlign.Middle
X: =imgSmileFair.X + imgSmileFair.Width
Y: =imgSmileFair.Y
- imgSmileFair:
Control: Image
Properties:
Image: "=\"data:image/svg+xml;utf8, \"&EncodeUrl(\"\r\n<svg xmlns='http://www.w3.org/2000/svg' viewBox='0 0 100 100' width='100' height='100'>\r\n \r\n <circle cx='50' cy='50' r='40' fill='#f8de7e' />\r\n \r\n <!-- Eyes -->\r\n <circle cx='35' cy='40' r='5' fill='white' />\r\n <circle cx='65' cy='40' r='5' fill='white' />\r\n \r\n <!-- Straight Mouth -->\r\n <path d='M 30 60 H 70' stroke='white' stroke-width='5' fill='transparent' />\r\n</svg>\r\n\r\n\r\n\")"
Height: =32
Width: =32
X: =imgSmileExcellent.X
Y: =imgSmileGood.Y + imgSmileGood.Height
- txtGoodScore:
Control: Text
Properties:
Font: =uiFont.Primary
Text: ="0.84 - 0.92"
VerticalAlign: =VerticalAlign.Middle
X: =txtSmileExcellent.X + txtSmileExcellent.Width
Y: =imgSmileGood.Y
- txtSmileGood:
Control: Text
Properties:
Font: =uiFont.Primary
Text: ="Good"
VerticalAlign: =VerticalAlign.Middle
X: =imgSmileGood.X + imgSmileGood.Width
Y: =imgSmileGood.Y
- imgSmileGood:
Control: Image
Properties:
Image: "=\"data:image/svg+xml;utf8, \"&EncodeUrl(\"\r\n<svg xmlns='http://www.w3.org/2000/svg' viewBox='0 0 100 100' width='100' height='100'>\r\n \r\n <circle cx='50' cy='50' r='40' fill='#66b366' />\r\n \r\n <circle cx='35' cy='40' r='5' fill='white' />\r\n <circle cx='65' cy='40' r='5' fill='white' />\r\n \r\n <path d='M 30 60 Q 50 75, 70 60' stroke='white' stroke-width='5' fill='transparent' />\r\n</svg>\r\n\")"
Height: =32
Width: =32
X: =imgSmileExcellent.X
Y: =imgSmileExcellent.Y + imgSmileExcellent.Height
- txtExcellentScore:
Control: Text
Properties:
Font: =uiFont.Primary
Text: ="0.93 - 1.00"
VerticalAlign: =VerticalAlign.Middle
X: =txtSmileExcellent.X + txtSmileExcellent.Width
Y: =imgSmileExcellent.Y
- txtSmileExcellent:
Control: Text
Properties:
Font: =uiFont.Primary
Text: ="Excellent"
VerticalAlign: =VerticalAlign.Middle
X: =imgSmileExcellent.X + imgSmileExcellent.Width
Y: =imgSmileExcellent.Y
- imgSmileExcellent:
Control: Image
Properties:
Image: "=\"data:image/svg+xml;utf8, \"&EncodeUrl(\"\r\n<svg xmlns='http://www.w3.org/2000/svg' viewBox='0 0 100 100' width='100' height='100'>\r\n \r\n <circle cx='50' cy='50' r='40' fill='green' />\r\n \r\n <circle cx='35' cy='40' r='5' fill='white' />\r\n <circle cx='65' cy='40' r='5' fill='white' />\r\n \r\n <path d='M 30 60 Q 50 75, 70 60' stroke='white' stroke-width='5' fill='transparent' />\r\n</svg>\r\n\")"
Height: =32
Width: =32
X: =20
Y: =30
- txtApdexScore:
Control: Text
Properties:
Font: =uiFont.Primary
Text: ="Apdex Score"
VerticalAlign: =VerticalAlign.Middle
X: =txtExcellentScore.X
Y: =txtAllLevels.Y
- txtAllLevels:
Control: Text
Properties:
Font: =uiFont.Primary
Text: ="All Levels"
VerticalAlign: =VerticalAlign.Middle
X: |+
=20
- conFormula:
Control: GroupContainer
Variant: manualLayoutContainer
Properties:
Fill: =RGBA(255, 255, 255, 1)
Height: =118
RadiusBottomLeft: =24
RadiusBottomRight: =24
RadiusTopLeft: =24
RadiusTopRight: =24
Visible: =varShowFormula
Width: =468
X: =72
Y: =47
Children:
- htmlFormulaTotal:
Control: HtmlViewer
Properties:
HtmlText: ="<b><font color=#98D046>Satisfied</font></b> + <b><font color=#f0620f>Tolerating</font></b> + <b><font color=#d73a3c>Frustrated</font></b> counts"
Height: =43
Size: =12
Width: =350
X: =110
Y: =Rectangle2.Y + Rectangle2.Height
- Rectangle2:
Control: Rectangle
Properties:
Fill: =Color.Black
Height: =1
Width: =htmlFormulaTotal.Width
X: =htmlFormulaTotal.X
Y: =56
- HtmlFormula:
Control: HtmlViewer
Properties:
HtmlText: ="<b><font color=#98D046>Satisfied</font></b> + (<b><font color=#f0620f>Tolerating</font></b> / 2)"
Height: =35
Size: =12
Width: =254
X: =Rectangle2.X + (Rectangle2.Width - Self.Width) /2
Y: =Rectangle2.Y - Self.Height
- txtApdexis:
Control: Text
Properties:
Text: ="Apdex score ="
VerticalAlign: =VerticalAlign.Middle
Y: =40
AccessAppScope: true
CustomProperties:
- SatisfiedCount:
Direction: Input
PropertyType: Data
DataType: Number
IsResettable: false
DisplayName: SatisfiedCount
Description: A custom property
- ToleratingCount:
Direction: Input
PropertyType: Data
DataType: Number
IsResettable: false
DisplayName: ToleratingCount
Description: A custom property
- FrustratedCount:
Direction: Input
PropertyType: Data
DataType: Number
IsResettable: false
DisplayName: FrustratedCount
Description: A custom property
- ApdexScore:
Direction: Input
PropertyType: Data
DataType: Table
IsResettable: false
DisplayName: ApdexScore
Description: A custom property
Using a Function (fka low-code plugin) to calculate the values
The values for the Apdex Score are calculated using a Function:
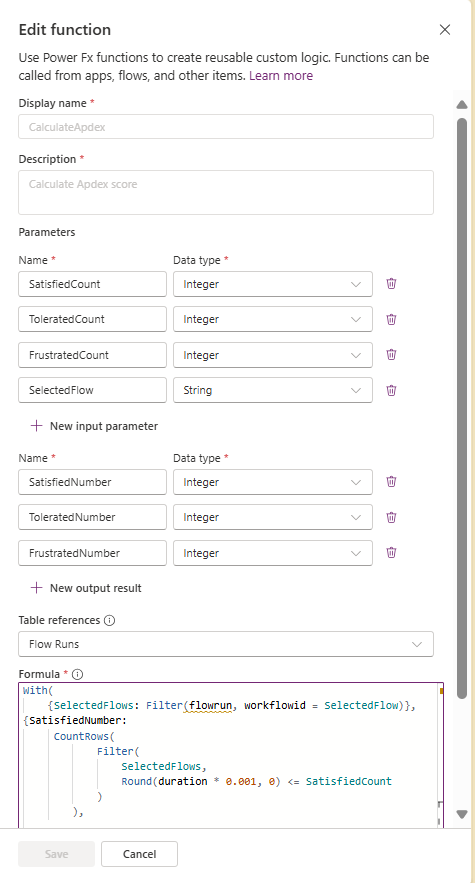
With(
    {SelectedFlows: Filter(flowrun, workflowid = SelectedFlow)},
{SatisfiedNumber:
     CountRows(
            Filter(
                SelectedFlows,
                Round(duration * 0.001, 0) <= SatisfiedCount
            )
        ),
ToleratedNumber:
     CountRows(
            Filter(
                SelectedFlows,
                Round(duration * 0.001, 0) > SatisfiedCount && Round(duration * 0.001, 0) <= ToleratedCount
            )
        ),
FrustratedNumber:
     CountRows(
            Filter(
                SelectedFlows,
                Round(duration * 0.001, 0) >= FrustratedCount
            )
        )})
Conclusion
Using Apdex scores provides an objective way to measure Power Automate flow performance and turn subjective complaints into actionable insights. By monitoring Apdex scores, developers can prioritize optimizations based on real data, improving the user experience.
To consider
- By default, flow run data is stored for 28 days
- See for more information on Microsoft Learn
- This metric can off course also be added to a PowerBI dashboard