Automated Dataverse low-code plugin
Jul 7, 2024 • 4 • 641
Table of contents
Side note: while writing this blog Dataverse low-code plugins are still in preview.
Scenario
This blog explores a real-world business scenario involving multiple meeting rooms where CO₂ levels are monitored throughout the day. These measurements indicate the presence of people in the rooms. By correlating this data with the meeting room reservations, we can infer the room occupancy.
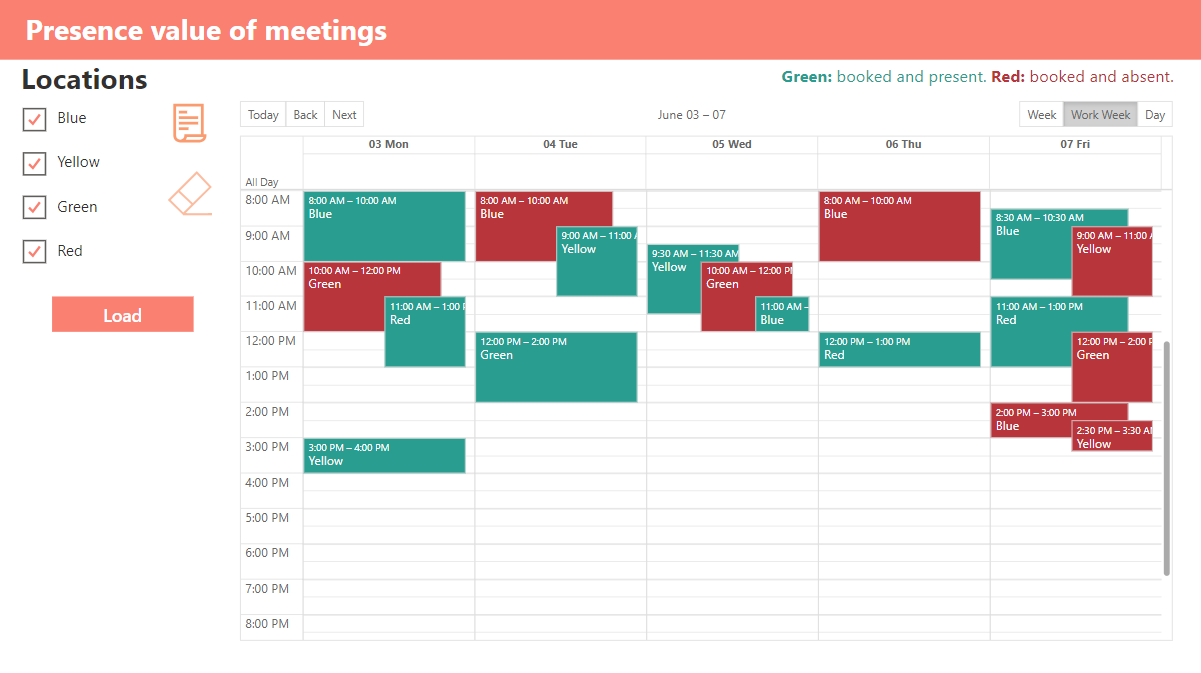
End result
The end result is a Power App in which a calender view is available in which you can see whether a meetingroom was occupied during the meeting or not. (due to the requirement to have calender view with different colors PowerBI wasn’t suitable)
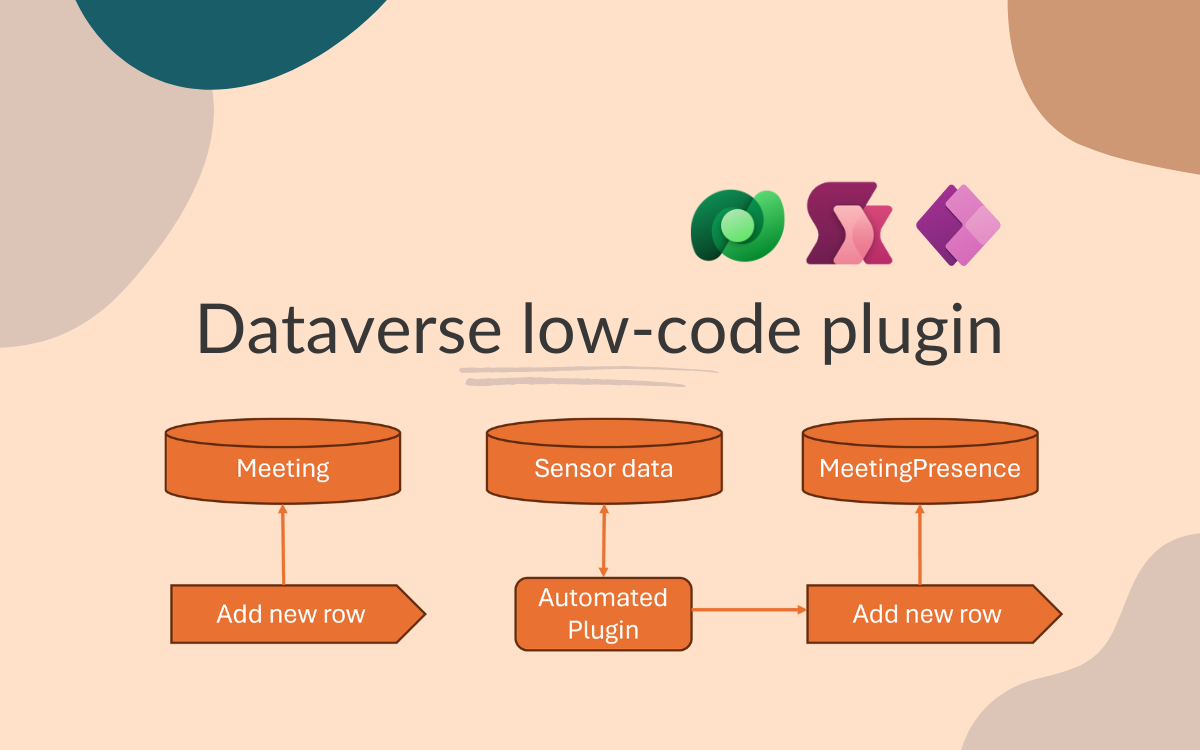
Architecture and process
The tables present to support this scenario:
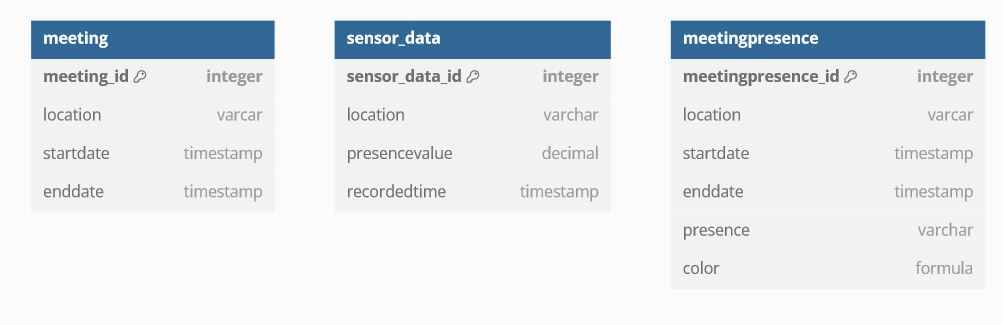
In the meeting table the original meeting date and times are stored including their location. In the sensor data table the sensor data is stored. In the meetingpresence table is updated by the plugin.
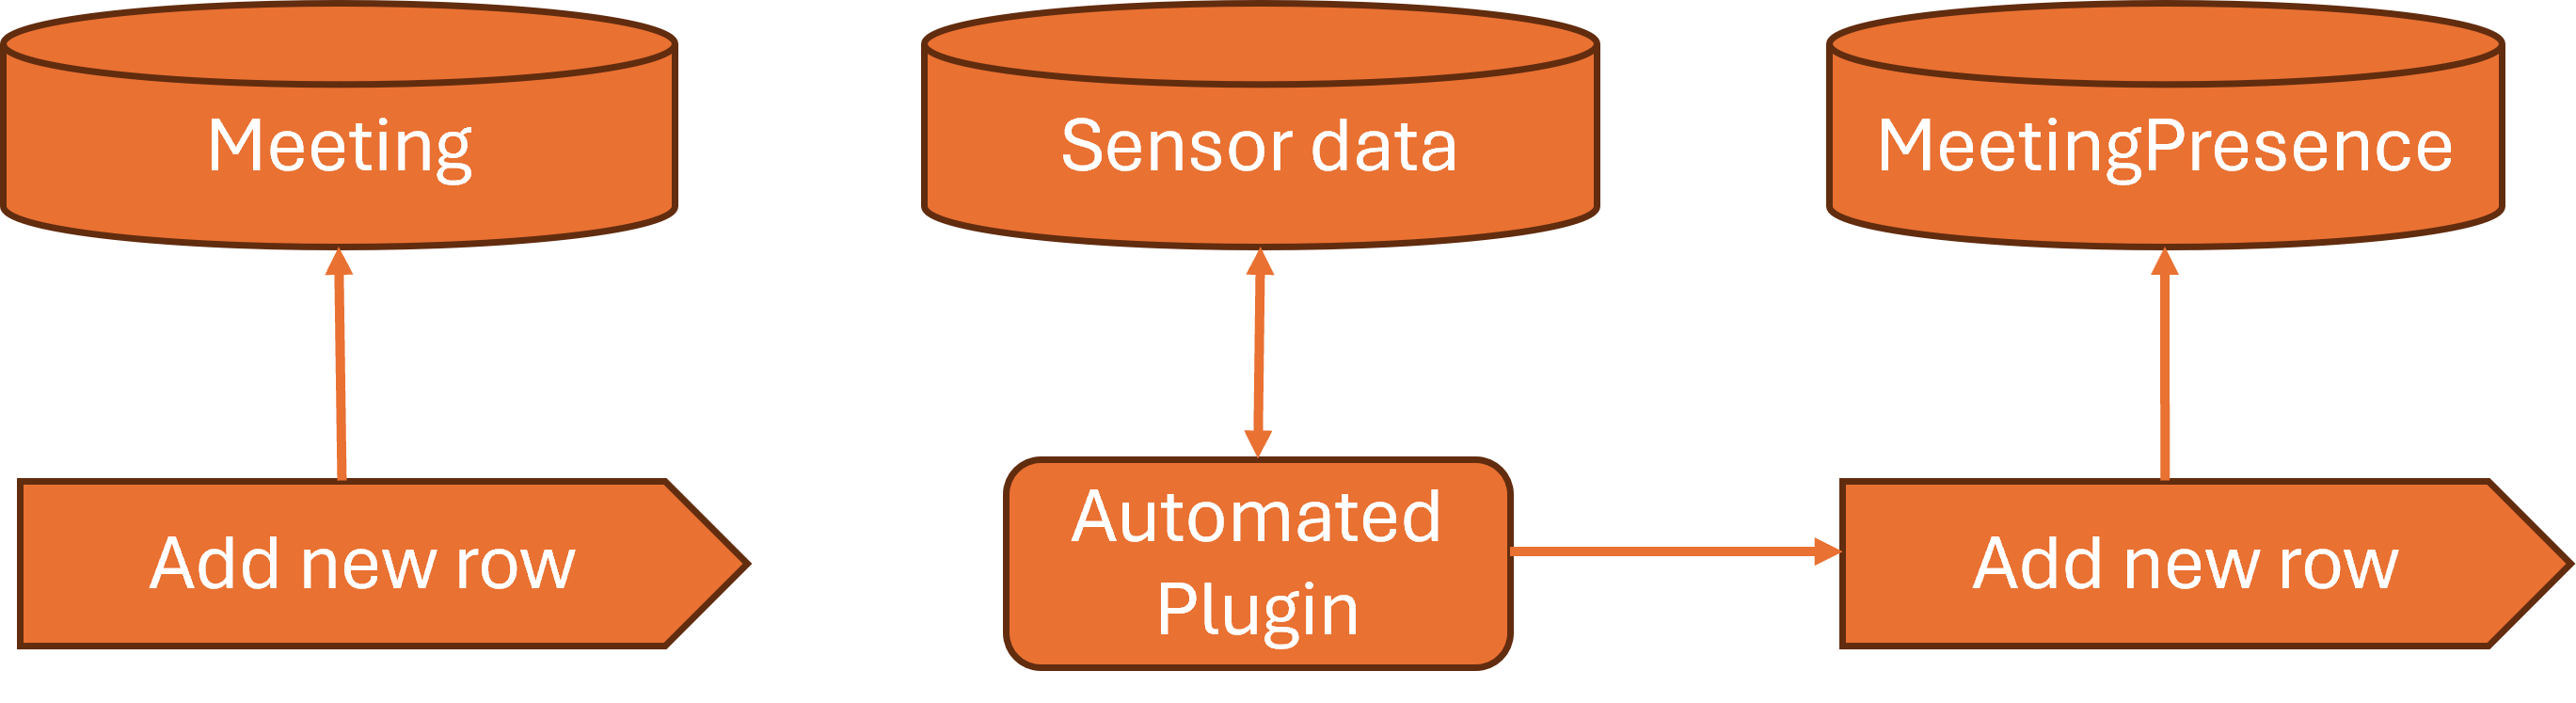
The following process is made:
Challenge
Meeting room reservations are updated in the table on a weekly basis, with the number of rows corresponding to the number of meetings at each location.
Sensor data is also loaded into the sensor data table weekly, generating substantial records. Data is available every 15 minutes on workdays between 08:00 and 18:00. For instance, if a location has 40 sensor data rows per day, this translates to 200 rows per week and 800 rows per month.
Example data for sensor data:
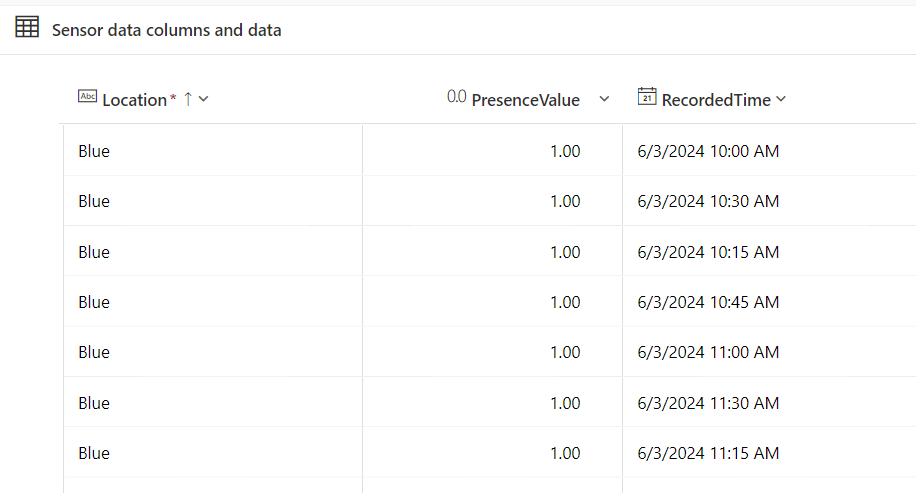
Dataverse plugin
By using the Dataverse Accelerator App you’re able to create a plugin. In this scenario it will be an automated one. As soon as a meeting is added into the table the plugin is fired.
Code to create new row in another table:
Collect(MeetingPresences, {
    Location: NewRecord.Location,
    'Start Date':NewRecord.Startdate,
    'End Date': NewRecord.Enddate,
    Presence:If(CountRows(Filter('Sensor data',RecordedTime >= NewRecord.Startdate && RecordedTime <= NewRecord.Enddate && Location = NewRecord.Location && PresenceValue = 1))> 0, "Yes","No")
    }
)
The formula Collect(MeetingPresences, {…}) adds a new record to the MeetingPresences table. For each new meeting, it captures the Location, Start Date, and End Date. It also checks if there is any sensor data indicating presence (PresenceValue = 1) within the meeting’s time range (RecordedTime between Startdate and Enddate) and at the specified Location. If such data is found, the Presence field is set to “Yes”; otherwise, it is set to “No”.
Meeting presence
In the meeting presence table the column Color is of type formula. Based on the presence value the color value is populated: If(Presence="Yes", "#299D8F", "#B7353B")
Power App
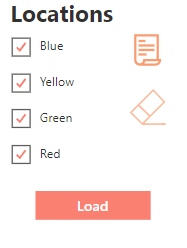
In the app only the records of meeting presence table are needed. The available locations are preloaded into a collection named ‘colAllLocations’. While selecting the location into the gallery a collection ‘colSelectedLocations’ is populated.
On the load button the meeting presence records for selected locations are loaded into a collection names ‘colCalenderEvents’.
Clear(colCalenderEvents);

ForAll(colSelectedLocations As Spaceloop,
        ForAll(
            Filter(
                MeetingPresences,
                Location = Spaceloop.Value
            ),
            Collect(
                colCalenderEvents,
                {
                    Meetingid: ThisRecord.'Meeting Presence',
                    Location: ThisRecord.Location,
                    Color: ThisRecord.Color,
                    Startdate: ThisRecord.'Start Date',
                    Enddate: ThisRecord.'End Date'
                }
            )
        )
);
The settings of the calendar component:
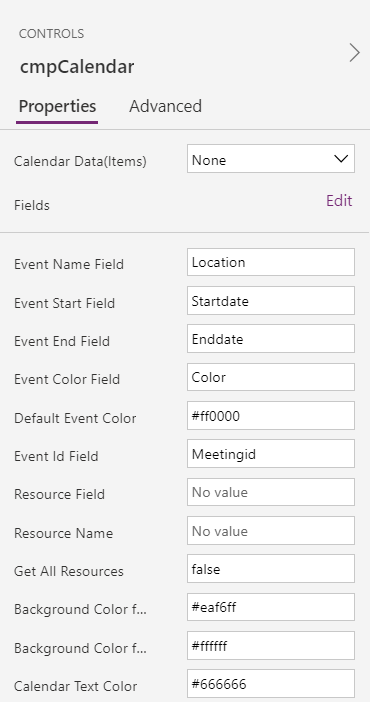 In the Items of the calendar component the collection is set as datasource: ‘colCalendarEvents’.
Selecting all locations results in a populated calendar view in which meetings are visually displayed by booked and present or booked and absent.
Conclusion
In the real-life business scenario, we dealt with 2,000 records across 16 locations. Knowing those amounts will grow over time. Initially, we created a collection of 16 items and performed lookups in Dataverse for each, searching for matches based on specific criteria. This approach led to poor performance and an excessively large collection that needed to handle 30.000 rows.
By using Dataverse automated low-code plugin, we offloaded the logic processing, reducing the number of records in the app significantly. This resulted in a substantial performance improvement.
Resources
- Calendar: To create the calendar view, the PCF component Calendar control is imported.
- Low-code plugin on Microsoft Learn